It’s amazing how difficult it can be to collect and utilize the right data across all of your delivery operations. And for good reason: managing delivery operations – whether first, middle or last mile – is complex, and many executives with delivery launched are still figuring out which delivery KPIs they need to measure, and which data needs to be tracked to enable that.
Identifying that data early on is critical, because delivery KPIs – and the resulting insights – have a powerful impact on your business.
What is a delivery performance KPI?
A delivery performance KPI (key performance indicator) is a metric that indicates how well your delivery operations or providers are -or aren’t – performing. Types of metrics used to measure delivery performance as KPIs include on time delivery (OTD), time per delivery, number of deliveries, order accuracy, and cost of delivery.
Too often, businesses are not tracking the right data across their delivery and fulfillment flows. Some can (theoretically) track average delivery time from a single store or warehouse, but it’s often not scalable. Think about it: how many businesses have delivery dashboards with concrete, statistical insights on customer satisfaction?
Executives are losing out on invaluable data that could provide them with transformational, high-level insights into everything from logistical efficiency, to delivery operations, brand power, and customer satisfaction, along with how all of these affect profit margins.
Based on our experience working with global enterprises and multi-fleet delivery operations, we’ve identified the five critical types of KPIs that businesses are overlooking the most.
The 5 types of KPIs you didn’t know you need
1. KPIs on Driver Data
To understand how your drivers impact delivery success and profit, you’ll have to go beyond basic location tracking. Route planners and route optimization solutions can minimize the amount of time a driver spends on the road, and if the actual time differs from planned time, it’s often down to unavoidable (but predictable) variables like traffic. But how much time does each driver spend loading? How much time do they spend on site?
Are dispatchers overestimating – or underestimating – time on site when planning routes?
Gathering hard numbers about how much time your drivers spend at each stage of the delivery process tells managers not only how drivers are performing individually, but also provides insight on delivery efficiency on a larger scale. If drivers spend less time on site or in the warehouse than planned for, future routing can take that into account and have drivers make more stops on the same run. Similarly, if drivers spend more time on site than expected, they may be taking unnecessary breaks or incorrectly loading items. In this case, once the problem is identified, drivers can be retrained.
KPIs related to driver data can help teams provide more accurate delivery windows and ensure that more deliveries occur on time. Customers are waiting; keep them waiting less often, and for less time, and it will have a massive impact on your rate of return customers.
See: 9 visuals of delivery KPIs
2. KPIs on Fleet Data
Not all delivery fleets are created equal – but many businesses assume they are.
Enterprises with hundreds of customer-facing stores often use multiple delivery providers, especially when they are spread across multiple regions or countries.
According to the 2019 Third-Party Logistics Study, a majority of shippers are reducing or consolidating the number of 3PLs used. Comparing performance data between multiple fleets, as well as between multiple drivers, helps executives make high-level decision about their delivery providers that directly impact their delivery capacity and performance.
Think about it:
A business works with a third-party delivery provider that is the highest-rated fleet in one country or state. Then, the business continues with the same provider in another state, even though that provider’s offering is not as strong, and may have far less capacity and slower deliveries than another provider in the same region.
The way to avoid this scenario and make the right business decisions is to have 360-degree visibility into your fleets, whether they are in house, third party, or a combination of the two.
There are numerous KPIs that can and should be used to compare fleets: driver time; time on site; average delivery time (taking into consideration average delivery distance); operational costs; and, most important of all, customer satisfaction rating.
3. KPIs on Customer Satisfaction
This is the KPI that has possibly the greatest impact on your sustainable profits – and it’s the one that is often the least tracked.
The advantages of working with third-party ecommerce platforms or 3PLs are counterbalanced by one factor: They leave you in the dark about your customers.
For example, aggregators in the food industry general provide companies with data about the number of deliveries, the items ordered…everything, in other words, up until the moment that the delivery flow begins.
What are your customer satisfaction ratings per store? Per region? Per delivery fleet, driver or aggregator? Are your delivery customers as happy with their order fulfillment as people who purchase in store, or pick up in store?
Businesses who are in the dark about their customer’s delivery experiences are equally in the dark about their how customer satisfaction is affecting revenue.
Properly collecting and aggregating this data can help executives understand what is working, and what has to change to improve customer loyalty and boost revenue from delivery.
4. KPIs for Revenue per store, region, and fleet
While sources of revenue are meticulously tracked, adding another visual layer to provide managers with more insight into how delivery performance affects revenue.
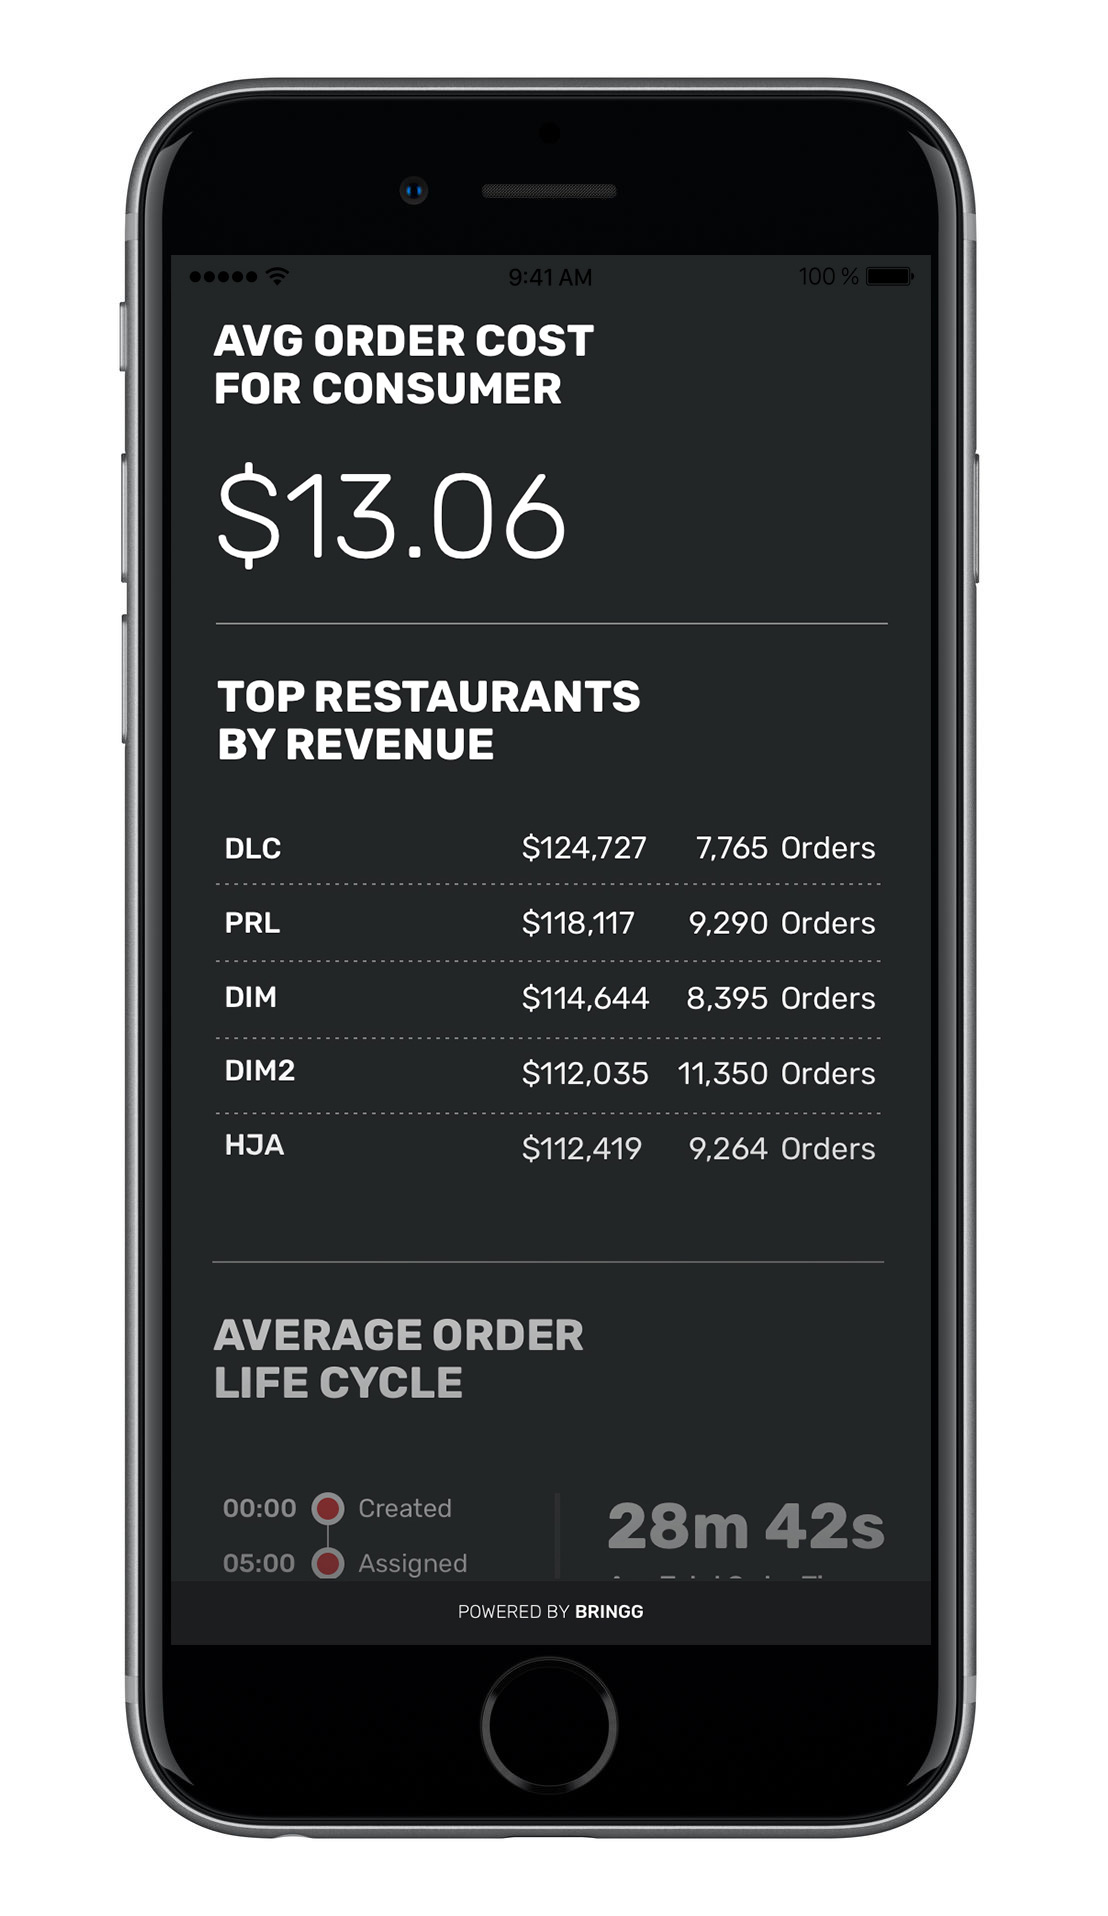
Imagine an executive dashboard that compares revenue with delivery times per region, and customer satisfaction. Executives drill down to understand those numbers by date, by store, and by fleet. In the process, they can discover important insights that would otherwise be overlooked. For example, a store might seem to be outperforming another store in revenue, but tracking revenue from deliveries may show a difference in revenue from in-store purchases versus deliveries. Also, tracking delivery KPIs helps executives understand revenue attribution in terms of the store and fleets used.
5. KPIs for POC Data
Measuring data from Proof of Concepts is different from measuring the success rates of a scaled-up delivery operation. For one thing, profit is not a factor. During the POC phase, delivery performance may improve, but revenue related to the POC decreases, due to the cost of development and launch.
To understand and accurately judge a POC’s performance, you will need to have data measurement capabilities set in place prior to launching the POC. Relevant KPIs to track are those related to operational efficiency and performance: on time delivery; auto dispatch rates; loading time; time on site; orders per driver, and more.
One KPI that is underutilized and not valued enough on the executive level is adoption by the people in the field.
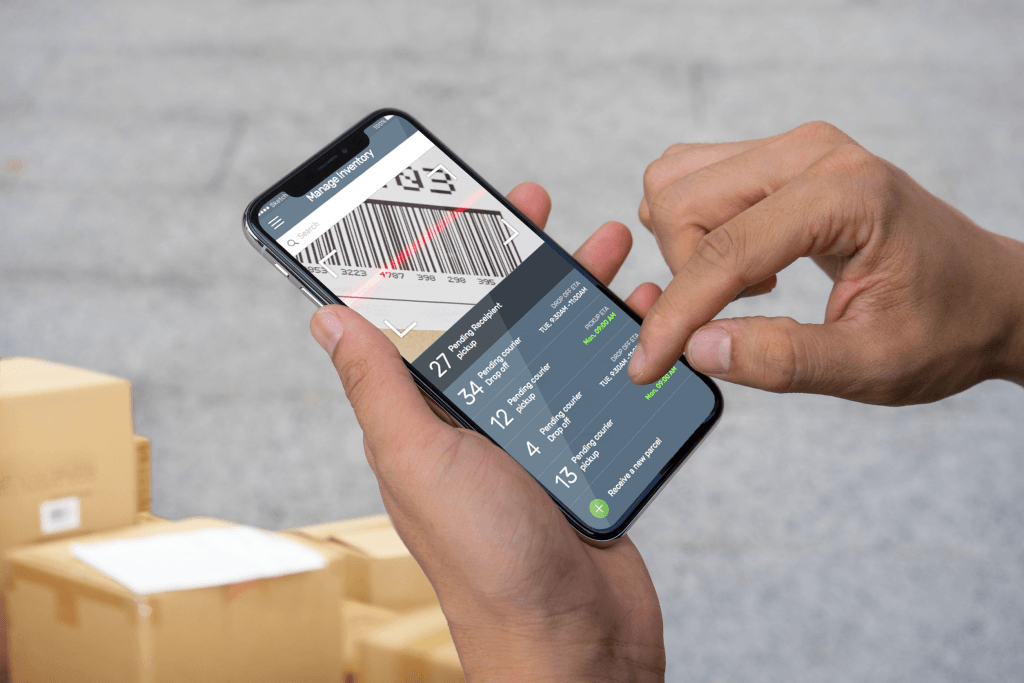
Executives can strategize, plan, and measure as much as they want; if drivers and dispatchers don’t use a POC system as planned, then the data from it – and KPIs based on that data – will be inaccurate, and the potential success of that solution will be limited.
Measuring and analyzing adoption rates is the only way to verify whether your delivery POC can be a success at scale.
If the POC has low adoption rates, then your implementation is imperfect- and you can fix it. That is the true power of measuring data: not just to verify where your deliveries are performing well, but to spot where and when things go wrong, in order to fix it on time.
The value of delivery data goes beyond deliveries. The right level of data-driven visibility can have a direct impact on internal efficiency, customer satisfaction, and, yes, your bottom line.
Make sure to define your KPIs, the data necessary to measure them, and ways to clearly visualize that data, as early as possible when planning delivery operations.
Frequently asked questions:
Delivery performance is measured by setting key performance indicators (KPIs) in various categories to measure performance and success over a period of time. By using the right KPIs to measure your performance, you’ll gain important insights to improve your business.
1. driver data – performance feedback, and on time delivery rate
2. fleet data
3. customer satisfaction
4. revenue per store, region, and fleet
5. POC data
